Share
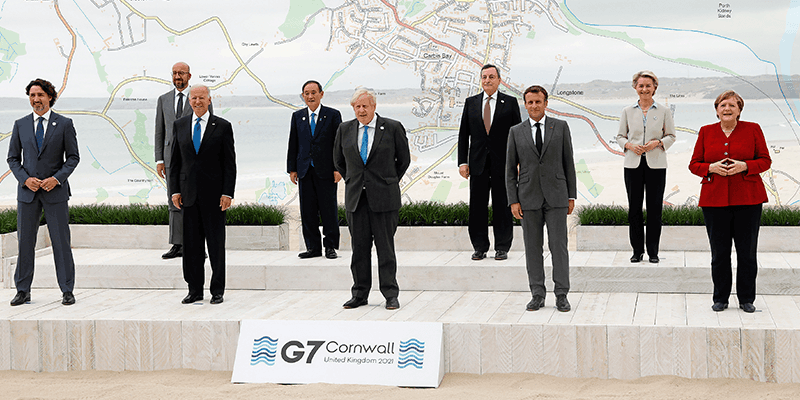
Gatherings of national leaders from around the world pose major challenges for the hosting country. The 2021 G7 Summit was no exception. We asked Robert Goldsmith, GIS and Mapping Manager at Devon and Cornwall Police, how GEOTECHNOLOGY played its part
GeoConnexion (GEO): The event required a considerable effort in planning traffic routing and security measures across several locations, as well as liaising and data sharing with multiple agencies at home and abroad. Can you give us an idea of the scale and scope of this work?
Robert Goldsmith (RG): When it was announced that Devon and Cornwall were to be the host of the 2021 G7 Summit, we knew that our police force would be tasked with developing some seriously complex security protocols. The pressure was on to ensure the security of the world leaders attending the event, while also being responsible for the safety of nearly two million citizens residing across over 10,270 kilometres. The COVID-19 pandemic further complicated things, as it removed the possibility of bringing together large groups of people at the event sites to do in-person planning.
GEO: What was the expected timescale from start to finish?
RG: We started collecting data in January 2021 - beginning with plotting key locations and other points of interest, which eventually evolved to onsite LiDAR capture. We were still collecting and providing geo data right up to the start of the event on 11th June. During the summit itself we worked overtime, during weekends and even through the night, to make sure we could provide a service to our partners located all around the globe should there be any urgent requests for mapping capabilities. We finished the project on the last day of the summit on 13th June.
GEO: What were the key challenges of the project, and how were these overcome?
RG: We had two major hurdles we had to cross during the planning phase. The first challenge was managing the sheer volume of security protocols needed for such a high-profile event, particularly given that the Summit was hosted in two locations. This meant that safety measures were required for different venues, as well as for each of the world leaders, as they travelled back and forth. The second was giving visibility to our security partners around the world, especially as the pandemic limited the ability for teams to travel to the site in the run up to the event.
To overcome the first challenge, we knew that we had to accurately plan out the travel routes from one location to the other in minute detail – including insight of potential road barricades, traffic patterns, and even rooftop visibility of the road from buildings along the planned routes. Location intelligence played a critical role in addressing this, as mapping capabilities allowed us to bring together data from multiple sources and formats to help provide the necessary context when assessing the safety protocols.
Using Precisely’s MapInfo Pro, we were able to generate 2D gridded map books of the venues and enrich it with points of interest (POI) data, such as foot bridges, cell masts, bus stops, and officer and partner locations. External datasets from other GIS units could also be fed into the same solution, and the map books could then be shared both digitally, or via hard copy, with our international partners – including the U.S. Secret Service.
The 2D maps also proved to be the ideal foundation for creating 3D visualisations. We used aerial drone footage to build out an initial model and further augmented it with 360-degree visualisations, using video footage that was captured by scanning over 140,000 square metres of the Summit venues. The result was a hyper-accurate virtual representation, or digital twin, of the entire area, allowing us and our partners to use virtual reality headsets to remotely access locations during the planning phase. This removed the need to have more individuals on the ground than necessary in the run up to the event, while still enabling highly accurate contingency planning to take place.
GEO: What datasets and other capabilities were sourced for the project and from where?
RG: During the planning process we essentially combined five individual GIS technologies, including 2D Maps (MapInfo Pro), Digital Terrain Models, Aerial Imagery, Large Scale 3D Models, and Drone Unit 3D Models.
The 2D maps from Precisely’s MapInfo Pro were augmented with 3D mapping capabilities with other solution providers. For example, height data from the Ordnance Survey was added to police drone aerial imagery, as well as 360-degree visualisations from NavVis VLX indoor 3D scanner.
GEO: Can you give us an idea of the key deliverables?
RG: The combination of all the GIS data and capabilities allowed us to create a virtual world that we could walk around in by using virtual reality headsets – visualising where our officers were going to be stationed and where our partners needed to be. The system gave us and our international partners the ability to see exactly what they would see as they entered and moved around a room, with the capacity to measure the distances between points and objects to an accuracy of just five millimetres. Essentially, it allowed us to have a complete model of the operation before it had even begun - an initiative that was unprecedented in the government space.
GEO: What key lessons for the future were learned?
RG: I believe that this project really demonstrates the untapped potential of GIS in public sector initiatives. Most government data has a location component to it that could be leveraged for a huge variety of benefits. In the future, I can see dedicated GIS resources being deployed to further help police forces assess accessibility of both public and private services. The possibilities for this are endless –whether it’s using it in assisting criminal investigations, planning the most efficient station for police officers each day, or more efficiently responding to emergencies.
We’re also currently working with Precisely to assess what datasets are available that could help enrich our contingency planning. During the summer months, the counties of Devon and Cornwall triple in population size due to tourist activity. More accurate seasonal data could better inform us about the necessary resources and planning required to respond to the influx of people and continue to maintain our position as one of the safest areas in England.


