Share
IN FORGING OUR WAY out of the pandemic, the task of levelling up communities is high on the government agenda, with new funding proposals being evaluated against social value criteria.1 Elspeth McIntyre suggests Britain’s new Freeports might be the ideal places to start – with geospatial data revealing the full picture of inequalities and opportunities

From fuel poverty to debt prevention, Instagram ‘likes’ to running apps, and energy ratings to traffic jams – individuals, communities and societies are producing data as never before. This all provides a golden opportunity to harness data that’s now available to help to unlock social value; because, by layering up this data using geospatial technology, you have a rich visualisation of what’s happening on the ground. You have multi-faceted information that can help determine where to make the best investment in and around Freeports and extract the most social value.
Seeing how patterns emerge
Everything starts with the data and having access to layers of data will allow Freeport planners to step back and take in a wider view of the issues on the ground – including achieving carbon net zero, levelling-up, and aiding Covid-19 recovery. This data will help planners see how patterns emerge in ways they could never have seen beforehand; because new forms of data offer us a gateway to a bird’s eye view, a full, layered picture of where all assets are – from schools to shops – and how they’re used.
Starting with data from the Office for National Statistics (ONS) we know broadly, within quite small geographic areas, a local population’s age, mental and physical health, employment and skills, and the industries they work in. By looking at historic data, we can, for example, ascertain where there was a local employment hub which is now absent, such as a shipyard, and form that we’d understand that the workforce was once highly skilled – but there are no jobs for those skills there now – so, we can pinpoint a new employment opportunity. We can then layer that picture up to understand what people there need for skilled employment to happen, and eventually for the local Freeport to become successful.
Bridging the skills gap
If local people had specialist manufacturing skills beforehand, for example, those are skills that could quite easily become transferable to Freeport activity. Geospatial data can show us nearby further education colleges, or technical colleges. By piecing the puzzle together, a connection between bridging a skills gap in the local workforce, and the opportunity for upskilling at the local college, is made. Then, as a recent report from Atkins and Microsoft explored2, it’s a matter of working out how the Freeport might benefit from these two factors. Here’s where the social value can be added, e.g., by providing apprenticeships, or making it easier and greener for people to travel to work there.
Similarly, if the Freeport takes up the space of ten football pitches, does that mean when it’s complete people will have to take a circuitous route to reach facilities on the other side? Must it be a block between two communities, or wouldn’t it be better during planning to recognise it as an issue and mitigate it by taking a more nuanced approach to Freeport borders?
By introducing pathfinding analysis, active travel analysis, or biodiversity corridors you can start making those ten football pitches into a valuable place that accommodates through-routes for cyclists and pedestrians around office spaces; that provides open green spaces that are accessible for all, including local residents; that makes provision for children’s play parks, wildlife ponds, and even areas for specialist wildlife conservation. This is what unlocking social value from government expenditure will look like in practice – and this is how geospatial technology can help us achieve it.

Creating better spaces
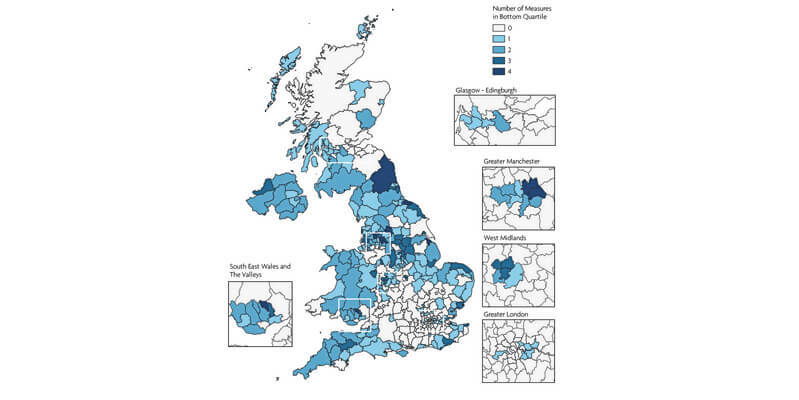
One example of how data layering has helped a local community came out of a project undertaken by Atkins in 2021. By analysing tracking data from the Strava running and cycling app (pictured lower left) in areas lacking facilities, it revealed that many people were running around a sewerage plant, creating a ‘desire path’ on a few scrappy metres of grass. To them, this was an area of precious, albeit not aesthetically pleasing, outdoor space. Without geospatial data, this pattern would never have been seen, leaving the users without hope of new facility provision.
The coming of the new Freeports is well-timed. Their planning will benefit from new census data available in 2022-2023, rather than relying on historic data from 2011.
And so, by layering this new data with other non-traditional forms of data, such as Strava, and using a spatial common data environment layered with tailored analysis tools to view assets spatially, we have a more rounded evidence base on which to make financial decisions. By viewing and analysing spatially, the interactions become explicit, with travel, deprived communities, biodiversity, and economic concerns all at play.
By looking at the representative data spatially, we get quicker answers to questions such as whether a Freeport could, with its vast available space, accommodate a large ground source heat pump for local housing schemes. Just one example of how a Freeport could help meet its Net Zero obligations while, at the same time, adding social value to its surrounding communities.
This is where the real value lies: being able to see all moving parts – warehouses, colleges, schools, traffic hotpots – in a single location; and not focusing on each issue separately in silos. Geospatial data can help us plan improvements strategically, by pinpointing valuable synergies, and in doing so, help to create true social value. There is now an imperative for this to happen via public procurement, so it’s an extremely valuable new tool to have in our armoury.
What and where are our Freeports?
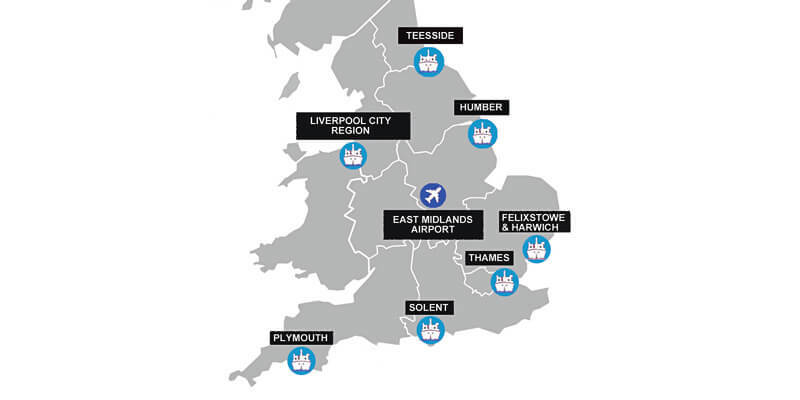
Announced by the government in the March 2021 Budget, Freeports are special areas within the UK’s borders where different economic regulations apply. They are centered around one or more air, rail, or seaports, but can extend up to 45km beyond them. Teesside was the first of eight English Freeports (see map) to open in late 2021 and all will be up and running by March 2022. Two Freeport sites will be chosen in Scotland later this year.
The government has worked in partnership with ports, businesses, local authorities, and wider stakeholders through a public consultation to develop a highly ambitious, world-leading Freeports model for England. This model will include a comprehensive package of measures, comprising tax reliefs, customs, business rates retention, planning, regeneration, innovation and trade and investment support. These incentives are designed to encourage the maximum number of businesses to open, expand and invest in our Freeports which, in turn, will boost employment.
1 Government Commercial Function publication, December 2020: The Social Value Model (https://assets.publishing.service.gov.uk/government/...)
2 https://www.snclavalin.com/en/...;
3 Levelling Up the United Kingdom. Government White Paper. Feb 2022 (https://www.gov.uk/government/...;
Elspeth McIntyre is Senior Geospatial Consultant with Atkins, one of the world’s most respected design, engineering and project management consultancies headquartered in Epsom, Surrey (http://www.atkinsglobal.com)&n...;


