Share
Recent enhancements in global data modelling led by the improvement in spatial data has resulted in organisations being able to model floods much more accurately. Oliver Wing and James Savage explain how
The ability to map flood zones globally – that is, delineate areas of land susceptible to inundation when rivers burst their banks – has been revolutionised in the past decade. Two things conveniently fell into place to make global flood modelling a reality: worldwide terrain and other geospatial data became available at high-resolution, and computers became fast enough to handle the calculation of water-flow equations over the tens of billions of grid cells this geospatial data constitutes.
The most important part of a flood inundation model is the quality of the elevation data over which it simulates water movement. We know that water flows downhill, but a flood model is of little use if it does not know what ‘downhill’ is! Transformative strides in the collation of data describing the elevation of the Earth’s surface were made in 2000 with the launch of the Shuttle Radar Topography Mission (SRTM), which consisted of an Interferometric Synthetic Aperture Radar (IfSAR) system mounted on NASA’s space shuttle Endeavour. However, SRTM collected is the canopies of trees and the roofs of buildings –neither of which a flood modeller is particularly interested in. Further, the grid spacing of the raw digital surface model (DSM) SRTM captured is one arc second (~30m at the equator) – while this is granular at the global scale, it is too coarse a resolution to capture the height difference between the ground surface and the tops of buildings and vegetation.
The upshot of this is that vegetated (particularly, forested) and urban areas appear as hills in the elevation data and would never flood – providing a useless tool for managing flood risk.
The SRTMDSM has undergone extensive corrections thanks to the global scientific community making it fit-for-purpose in the context of flood inundation modelling. On top of urban and vegetation biases, a number of other errors have been ironed out. Noise inducing radar speckle, no-data voids, and systematic ‘striping’ errors caused by the pitch and yaw of the shuttle are characteristic of raw SRTM data, but innovative algorithms have been devised to correct these and generate a “bare earth” digital terrain model (DTM). The final consideration made by scientists is the raw vertical accuracy of the radar instrument, which can be the order of metres. This is dampened somewhat by aggregating to three arc seconds (~90m) resolution, where vertical errors are smoothed via averaging. While newer global datasets have been collected from spaceborne instruments since 2000, they are either commercially privileged or have not benefited from the same level of error correction as SRTM. Corrected versions of SRTM remain the best source of elevation data for global flood modelling.
A DEM with merit
Fathom scientists aided in the generation of the most recent and accurate version of global elevation data – MERIT DEM – led by Dai Yamazaki at the University of Tokyo. You can see from Figure 1 the effect of this new dataset on floodplain. Clear artefacts – the erroneous striping effect – present in previous versions along the Mekong River in Vietnam have been removed, resulting in much more realistic flood extents.
Comparing flood simulations using original SRTM data and MERIT DEM evidences this further. In the Argentinian example in Figure 3, corrected striping and radar speckle have produced a flood map of much greater fidelity.
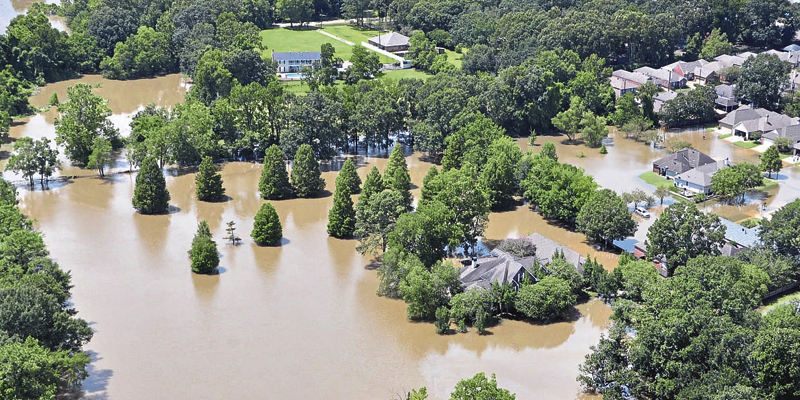
Spinning off from the collection of elevation data is the derivation of global hydrography data: that is, maps of the locations of the world’s rivers. While some semblance of the river channels will be present in the elevation data – often enough to infer their location – the dual effect of grid resolution and failure of the IfSAR to penetrate the water surface mean we cannot garner how deep the rivers are. River channels convey the bulk of flood flows and interact in important and complex ways with the slower out-of-bank flows on the floodplain.
Research has shown how crucial their explicit representation is beyond the elevations surveyed from space. Fathom has derived innovative algorithms based on hydraulic geometry theory to ensure channels appropriately convey flood flows in a simulation, but for this to be a worthwhile endeavour we need to know where the rivers are located.
A previous global dataset, known as HydroSHEDS, is based exclusively on the slopes evident in older versions of SRTM. These data transpire to often be some way off in the delineation of global rivers. A newer dataset, produced again by Dai in collaboration with Fathom scientists, was recently produced based on MERIT DEM, as well as other data sources such as OpenStreetMap. We can see in Figure 4 that the resultant dataset – MERIT Hydro –much better captures channel locations. The Chao Phraya River in Thailand (pink), which flooded so severely in 2011 that the price of Western Digital’s hard drives rose 47% as a result of supply shortages (their warehouse circled in red), was placed in the wrong valley far away from high concentrations of exposure in the HydroSHEDS data. This results in a substantial misestimation of the resultant flooding. Meanwhile, MERIT Hydro locates the river much more precisely.
The next generation
The next-generation global flood model produced by Fathom leverages these new data sources to produce estimates of flooding with unprecedented accuracy. We have developed smart methodologies to add value to these new data developments–most notably in the representation of river channels and in the accounting for structural flood defence measures. Such tools provide critical information for the management of flood risk globally, particularly in the developing world where local scale engineering models are often lacking. Fathom’s flood model permits insurers and re-insurers to confidently expand their exposure into regions with historically low insurance penetration, generating much needed resilience to flood disasters when the inevitably come. The World Bank also uses this data to guide investment in developing regions away from risky areas. Large corporate multinationals also leverage Fathom data to assess the flood risk of their global assets so they can make informed risk mitigation decisions. These maps will be increasingly important with the present and continuing threat posed by climate change, which is likely to induce a global increase in the frequency and severity of damaging flood events. Looking to the future, an expansion in the planetary coverage of LiDAR based elevation models will herald the next evolutionary leap in global flood modelling accuracy.
Oliver Wing is chief research officer and James Savage is senior developer at Fathom (www.fathom.global)


