Share
3. Speedâ©
Following events such as natural disasters, imagery itself can be made available to end users within hours of acquisition. DigitalGlobe has invested in a network of ground terminals distributed across the globe that allow imagery to be captured, processed, and distributed to the final users within minutes from collection.â©
Speed can also be assessed as a function of time relative to the mapping of large areas. Using traditional mapping techniques, cartographers typically take four to five years to create authoritative maps. These timelines are no longer acceptable for today’s geospatial needs. The remote sensing industry has started leveraging high performance computing (HPC) and cloud computing to make these tasks faster and more efficient than ever. â©
Fig.7 illustrates three years’ worth of cloud-free imagery available over Mexico from the DigitalGlobe archive, and the corresponding orthomosaic of Northern Mexico at 50 cm resolution created by DigitalGlobe in less than three days.â©
4. Analysisâ©
Today, DigitalGlobe’s archive has more than 4.5 billion square kilometres of imagery. As users have started mapping and monitoring the world at unprecedented rates, there is a growing need for information suited for “actionable intelligence” and decision making. â©
This need is leading the geospatial industry toward sophisticated information extraction techniques that were never possible before. For example, DigitalGlobe uses a combination of automated tools for generating derived products over large areas using various analysis techniques. Information layers created through these analyses leverage imagery’s rich spectral, spatial, and angular information to create derived-information that is complete and ready to fulfil the user needs in many domains.â©
With the growing acceptance of “crowdsourcing” the geospatial industry is now able to leverage almost any person to help rapidly add information to pixels. For example, as tornados touched down in Oklahoma in May 2013, DigitalGlobe tasked its satellite constellation to capture imagery of the area. Upon collection, DigitalGlobe launched its recently acquired Tomnod Crowdsourcing System (TCS) to help extract information from the image. The crowd was able to quickly and efficiently locate affected areas in order to help with the delivery of aid and support. â©
DigitalGlobe’s TCS approach is most powerful in situations where rapid insight is required in order to enable fast decision making. In support of the Oklahoma crisis, announcements were sent out to the crowd on Facebook and Twitter, and to dedicated groups, such as CrisisMappers. Users were given a short tutorial and then asked to view the imagery and identify destroyed buildings, tarped roofs, and fallen trees. Within 60 minutes, over 15,000 points of interest were collected by the crowd and the crowdsourced damage map was immediately published online. The damage map in Fig.8 highlights the trail left by the tornado of destroyed buildings (in orange) as identified by members of the TCS crowd. Just off of the main path of the tornado, it is possible to see the tarped roofs that had been identified (in blue) where buildings were partially damaged by high winds or flying debris.â©
5. WorldView-3â©
The latest trends in the geospatial industry have influenced the design of DigitalGlobe’s newest satellite. WorldView-3, expected to launch in 2014, is expected to be the first very high spatial resolution, multi-payload, super-spectral commercial satellite. â©
Operating at an expected altitude of 617 km, WorldView-3 will be capable of collecting 31 cm panchromatic, 1.24 m visible and near infrared, and 3.7 m short-wave infrared imagery (up to 680,000 square km per day), with an average revisit time of less than one day and positional accuracy of 3.5 m CE90 (or better) without ground control points. â©
It is expected that WorldView-3’s new SWIR bands will significantly impact surface compositional modeling, and mapping of rock and soil exposures worldwide. Potential applications include: improved geologic mapping, environmental and disaster monitoring, exploration for petroleum, minerals, and geothermal resources, as well as other non-renewable resource assessments.â©
The placement of SWIR bands is determined by water molecules absorbing light at specific SWIR wavelengths, rendering the atmosphere nearly opaque in these ranges. Remotely sensed data must, therefore, be collected in atmospheric windows between these water absorption wavelengths. â©
There are three atmospheric windows in which WorldView-3 has SWIR bands. The first window is centered near 1250 nm. Bands here are useful for bracketing iron absorption features at shorter wavelengths. Vegetation indices that are sensitive to leaf moisture content, such as NDWI, also use bands within this 1250 nm window. The second SWIR window is between about 1500-1750 nm. Man-made materials and chemicals have multiple absorption features in this range; examples include plastics, fiberglass, and petroleum. Snow and ice can also be differentiated from clouds in this window. The third atmospheric window lies between about 2000-2400 nm. Mineral absorption features are the focal point in this range. With sufficient sensor radiometric resolution, unique mineral identifications and chemical measurements can be made.â©
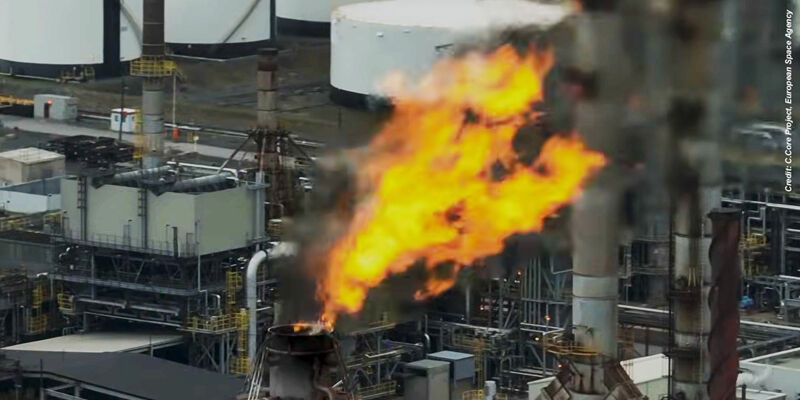
Collecting satellite imagery in both NIR and SWIR wavelengths has unique benefits, including improved atmospheric transparency and material identification. Because of their chemistries, many materials and substances have specific reflectance and absorption features in the NIR and SWIR allowing for their characterization from space. Examples include: vegetation; minerals used in economic mineral exploration; urban features such as roofing and construction materials (and their weathering); petroleum (e.g. spilled); and a variety of other man-made chemical compounds. Snow and ice show distinctive variations in some SWIR bands and, because of the wavelengths, SWIR bands can even penetrate some types of smoke, such as from a forest fire as shown in Fig.9.â©
In addition to the 17 bands comprising NIR and SWIR, WorldView-3 will carry a separate instrument, named CAVIS, specifically designed to measure the atmospheric components necessary to improve the consistency of image quality and create accurate metadata on clouds and snow/ice. CAVIS, which stand for Clouds, Aerosols, water Vapour, Ice and Snow, is composed of 12 additional bands of 30 m resolution in the VNIR and SWIR part of the spectra, with two bands having stereoscopic characteristics to allow the extraction of 3D features at each overpass. The bands of WorldView-3 are illustrated in Fig.10.â©
CAVIS is expected to greatly improve imagery yield, particularly in hazy areas. The consistency of image values, regardless of different atmospheric conditions, improves the performance of data analysis for land cover and change detection applications, facilitates multi-temporal and cross-sensor comparison, and enables the extraction of information using physical quantities. Fig.11 illustrates the effects of image normalization using the information derived from the CAVIS data. â©
Kumar Navulur, Fabio Pacifici and Bill Baugh – DigitalGlobe (www.digitalglobe.com)
Subscribe to our newsletter
Stay updated on the latest technology, innovation product arrivals and exciting offers to your inbox.
Newsletter