Share
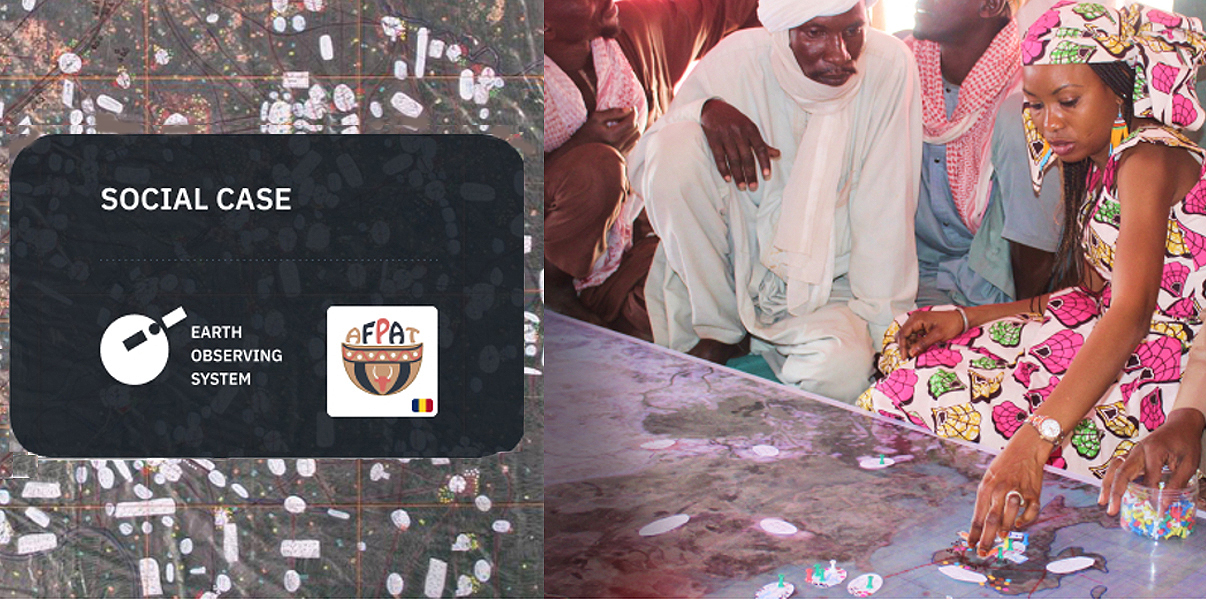
EOS Data Analytics provides cartographic material for a Participatory Mapping Project in Chad
Communities in developing countries, such as Chad, that rely on pastoralism and subsistence farming to provide for themselves and their families, are especially at risk of extreme weather events driven by climate change. Such extremes lead to a shortage of natural resources and/or a deterioration in their quality. For a population whose food security and overall well-being depends on access to natural resources, climate change is not just an abstract term — it poses everyday challenges.
Chadian government officials and decision-makers are, of course, responsible for monitoring environmental impacts and improving people’s standard of living, but often fail to do so. What communities can do is evaluate how they use remaining resources and find ways to ensure those resources are available for future generations.
This social case study is one example of cooperation between communities that are striving to adapt to the consequences of climate change: a scarcity of fertile land and freshwater.
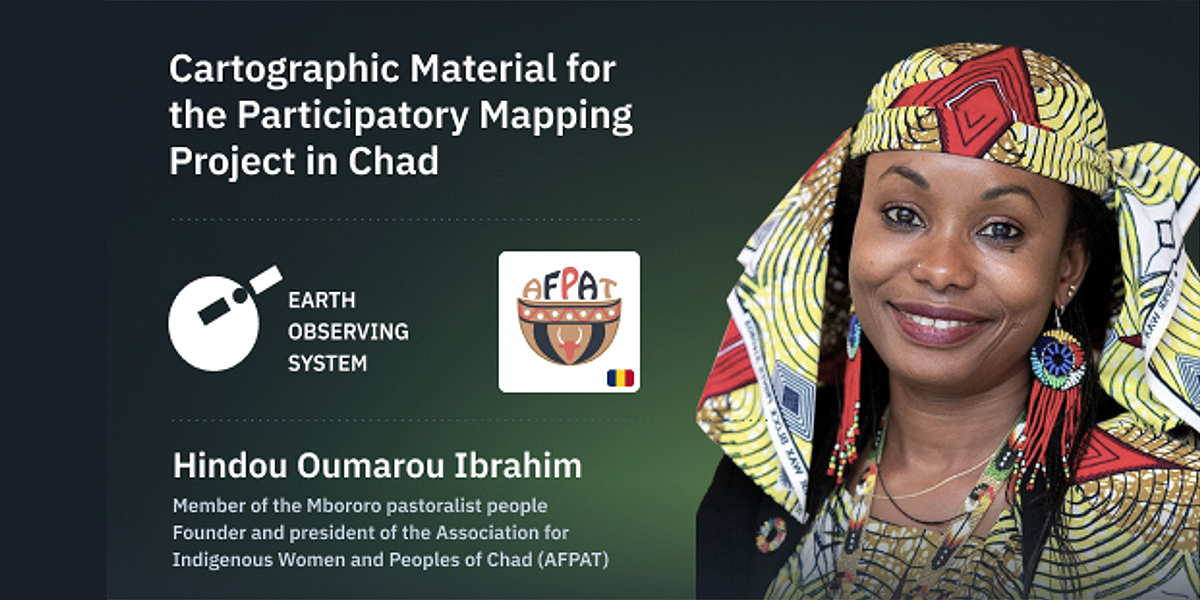
EOS Data Analytics (EOSDA), a global provider of satellite imagery analytics, contributed to the participatory mapping project organised by Hindou Oumarou Ibrahim, a member of the Mbororo pastoralist people and founder and president of the Association for Indigenous Women and Peoples of Chad (AFPAT).
The project aims to mitigate the conflict between local populations and indigenous communities over limited natural resources and to help indigenous communities adapt to climate change.
EOSDA obtained a satellite image of the area of interest with its EOS LandViewer, and created a printable map layout with annotated natural and artificial objects to make it ready for mapping by locals. But before we dive into the details of the project, let’s examine the factors behind the dwindling natural resources in the country.
What went wrong with Chad’s climate?
As of 2019, Chad was placed last in a list of 182 countries that are (a) vulnerable to climate disruptions and other global challenges and (b) their preparedness to improve resilience to those challenges (source: the Notre Dame Global Adaptation Initiative index).
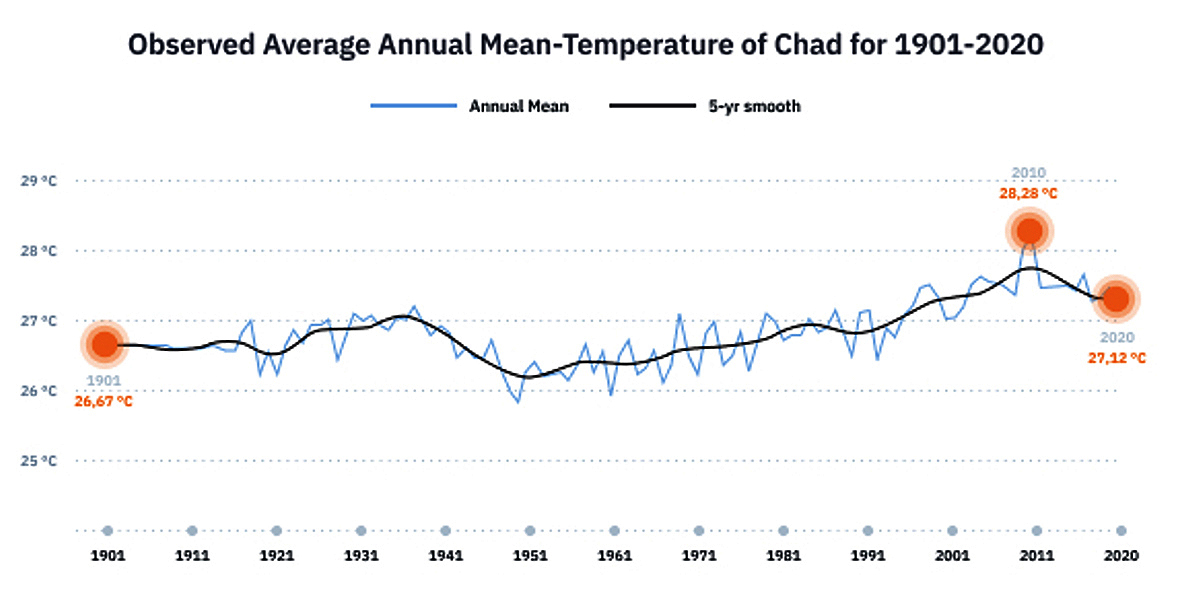
A key challenge is rising temperatures, with mean annual temperatures in Chad having increased by 0.7°C since 1960. Temperatures in its northern, western, and eastern provinces are predicted to be increasing 1.5 times higher compared to the global average.
Rising temperatures disrupt the state of flora and fauna and weather patterns, particularly rainfall. Chadians have been suffering for decades from ever more weather extremes such as droughts and floods.
In 2021 alone, more than 250,000 people (some 42,000 households) were affected by floods across the country, resulting in the loss of livestock, damage to cultivated land and crops, and destruction of houses. The nation has also been scourged by droughts, causing substantial land degradation; loss of soil fertility, lower productivity, and a decrease in biodiversity. As such, those practicing rain-fed agriculture and subsistence farming have fewer resources to maintain their livelihoods. A housing crisis due to flood damage, combined with famine and related anxieties, can too easily provoke outbreaks of violence.
Mitigating the causes of conflict
The disruption due to climate change has already given rise to conflict … one that has lasted for 15–20 years in the country’s Mayo-Kebbi Est region. The reason? Nomadic pastoralists from indigenous communities and local farmers couldn’t agree on the fair use of land and freshwater points. Land and water are essential to both communities, and climate change has created issues that cause conflict.
Land. Shorter and more irregular rainy seasons cause drought, forcing farmers and pastoralists to change their traditional land-use patterns. Farmers need more land to get the same yield of food crops, while nomadic herders need new pastures. Transhumance corridors — strips of land used to move cattle from pasture to pasture — may run through cultivated lands. Farmers may also establish their plots next to cattle corridors, leaving no space for livestock to pass through to grazing land.
Water. Lack of rainfall also leads to water points drying up, which is why pastoralists are forced to look for additional sources of water (rivers or lakes). Where there is a village, there is agricultural land. Government and military representatives often sequestrate these water sources, denying access to nomadic pastoralists and those farmers who rely solely on rainfall for irrigation. Conflict can also arise where herders’ cattle damage crops in fields that are ready for harvesting.
Fortunately, there are ways to reduce such disputes by initiating dialogue on how to coexist amid resource scarcity and adjust to a changing environment. Precise satellite mapping of large areas with scarce land and water resources is one such measure. EOSDA has recently been working with Hindou Oumarou Ibrahim, founder, and president of AFPAT, by providing a map for a participatory mapping exercise.
Harnessing local knowledge to technical expertise
As part of this exercise, leaders of 116 communities from 23 villages met to agree on the sustainable use of limited natural resources.
Participatory mapping entails the creation of maps by local communities to meet their needs. Such initiatives mainly take place with assistance from NGOs, tech companies, educational establishments, and other interested parties. Participatory maps often represent a given territory from a local perspective that reflect natural physical and essential socio-cultural features.
The initiative aims at establishing peaceful and sustainable management of shared resources. It might help indigenous people be less vulnerable to climate change while maintaining their traditional lifestyle.
Indigenous peoples’ knowledge stems from observing nature. For example, one can predict rain by observing the behaviour of insects or studying the sky. A person may also know where to find specific medicinal plants, or which fruits or leaves are edible, and so on.
The technical expertise was represented by EOSDA and by Giacomo Rambaldi, an international consultant in participatory mapping.
During the process of mapping, community members can identify disputed areas and shared water points, negotiate rules of their use, and agree compromises: e.g., to plan areas for growing crops; to open or close cattle corridors; to coordinate when and where to allow cattle onto fields to fertilise them, and when and where to bring cattle to water points.
Project Implementation
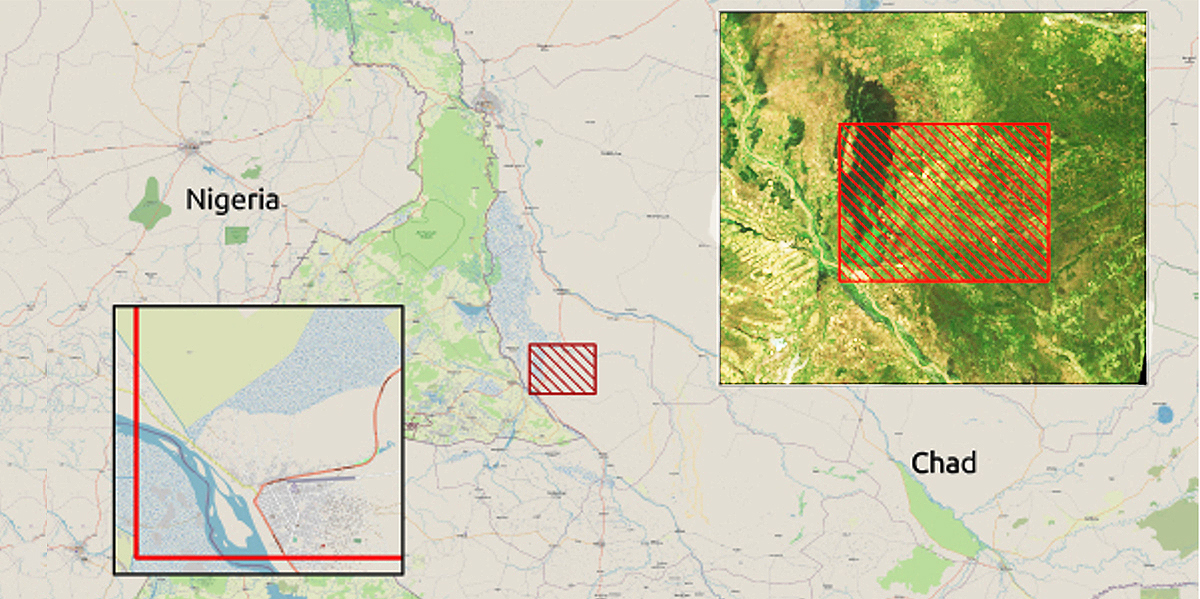
The provided 2D map, based on a satellite image, covers 1,728 square kilometers of territory.
The map creation consists of several stages. Here’s a short overview of all the stages.
1. Consulting with indigenous communities and formulating scope of work
The project starts with a preliminary stage. Its goal is to involve community chiefs in discussing the issues fuelling conflict and defining the area of interest. Hindou Oumarou Ibrahim began hosting meetings and workshops in 2019, and in November 2021, the communities agreed on the territory the map must cover. Giacomo Rambaldi transformed the scope of work into requirements for EOSDA.
2. Cartographic material preparation by EOSDA
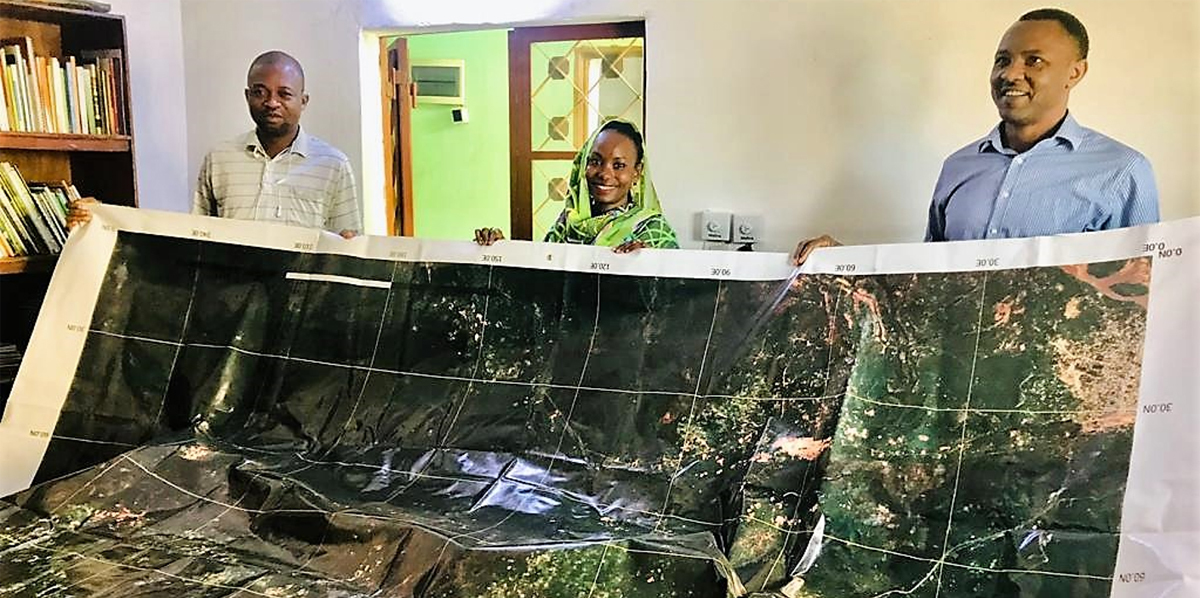
This stage entails preparing a 2.8 m x 2.3 m map layout and consists of two steps.
1. Obtaining a satellite image. The satellite image was obtained using EOS LandViewer, a satellite observation imagery tool that allows searching, processing, and extracting valuable insights from satellite data. The imagery was taken by the Sentinel-2 satellite at a resolution of 10 m, which means that one pixel represents an area of 10 m x 10 m (100 m2) on the ground. Consequently, the scale of the required map is where one cm equals 10,000 cm (100m) of the territory.
2. Preparing a map layout in QGIS. The image was then edited in QGIS — an Open Source software package for viewing, managing, and analysing spatial data and composing maps. The editing entails map annotation — creating a vector image layer with objects of various types and adding it on top of the satellite image.
The elements include lands with high and low vegetation density, croplands, wetlands, the Chari River, and man-made objects such as settlements and roads.
It’s essential to ensure objects are added with accuracy. Otherwise, a map will be useless.
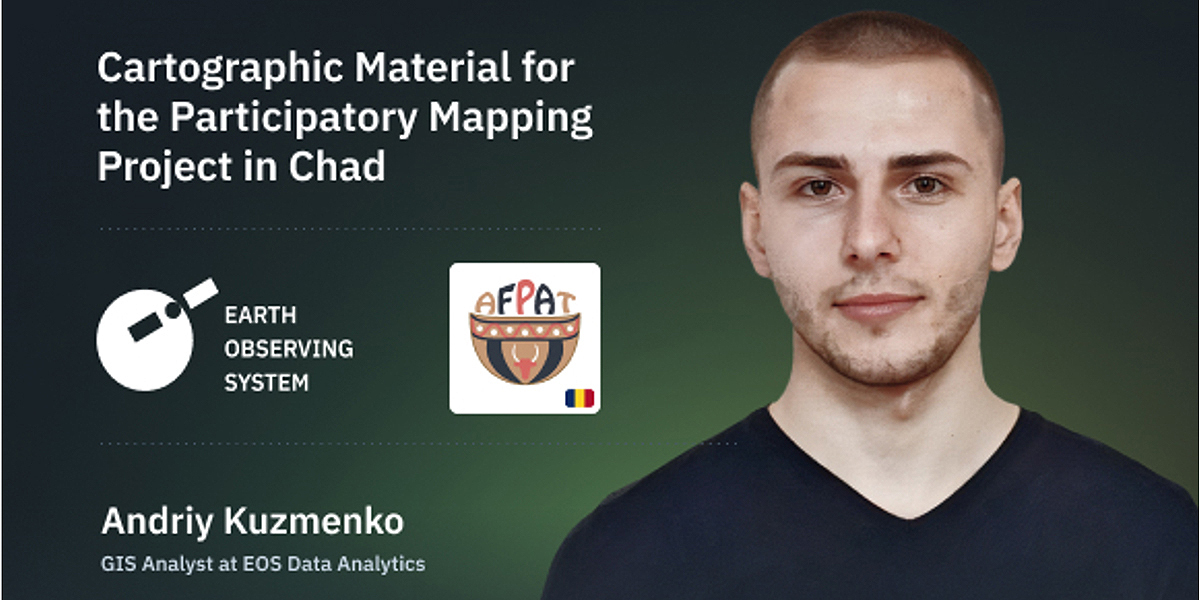
“To be precise, one must consider the brightness and spectral characteristics of objects. For instance, different levels of vegetation can be classified based on the values of vegetation indices (Normalized Difference Vegetation Index, leaf area index, and other types of spectral indices)” explains Andriy Kuzmenko, GIS Analyst at EOSDA
A satellite sensor can capture reflected sunlight (energy) in fixed ranges of the electromagnetic spectrum. Light travels in the form of waves. And since a plant absorbs and reflects specific wavelengths based on its current condition, it’s possible to evaluate its biomass and vigour.
Kuzmenko continues: “Spectral indices are also used for detecting water objects. Additionally, one can use open data sources such as OpenStreetMap to identify objects on the surface and add them to the map. While working with the RGB image, we relied on brightness and contrast parameters, which allowed us to choose similar groups of objects for further map annotation.”
Once all objects were added, the map was exported in PDF format, ready for printing and participatory mapping.
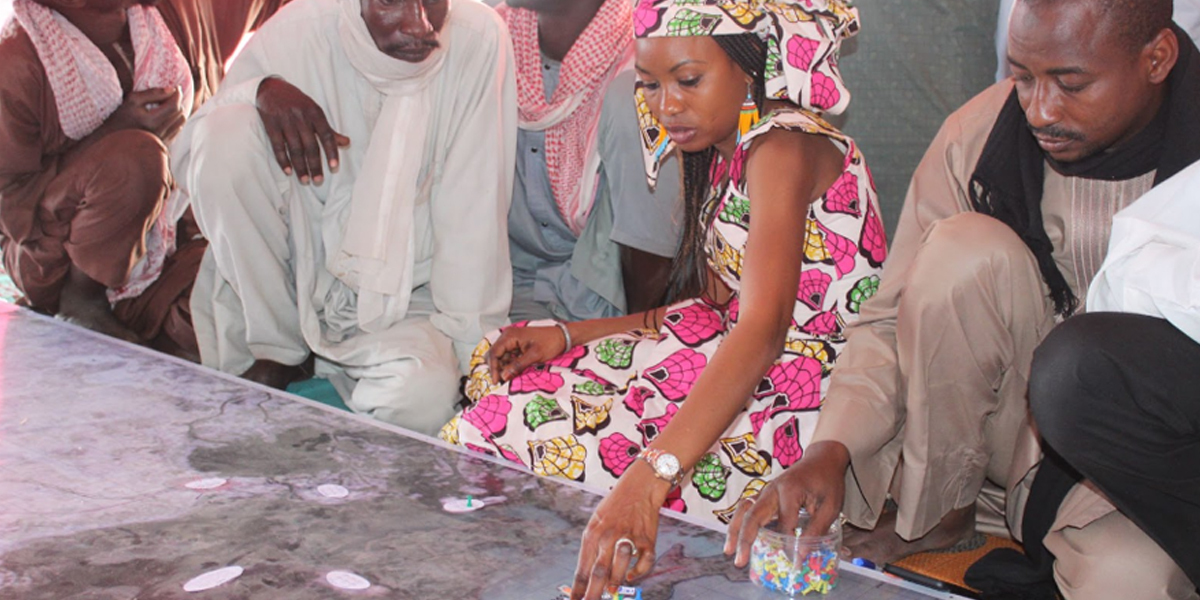
3. Map Annotation by indigenous peoples and local communities
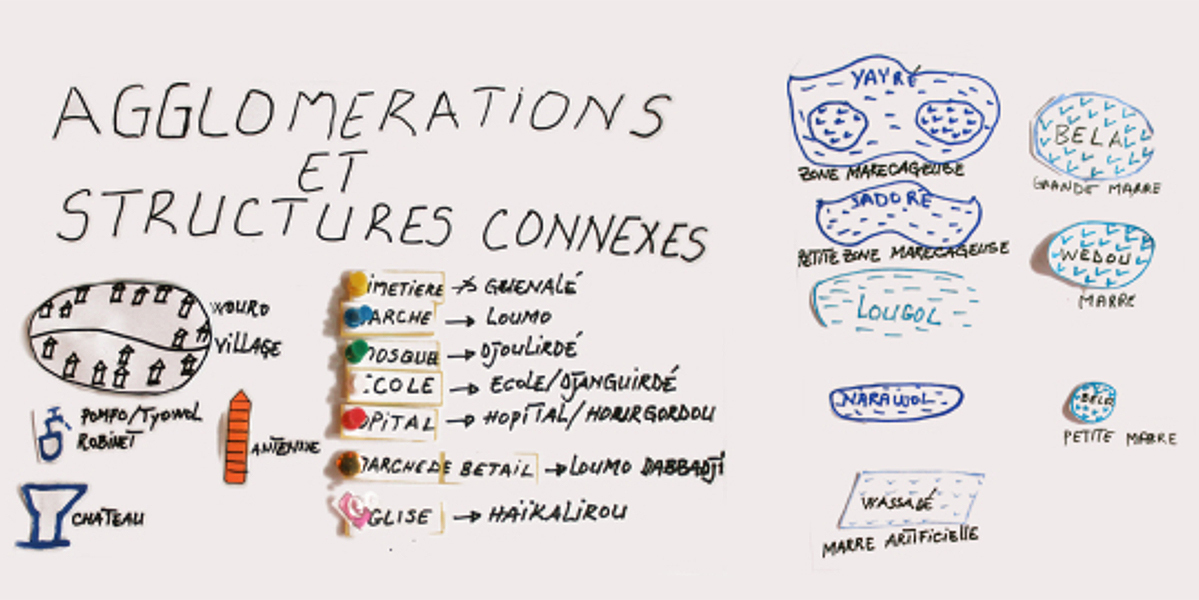
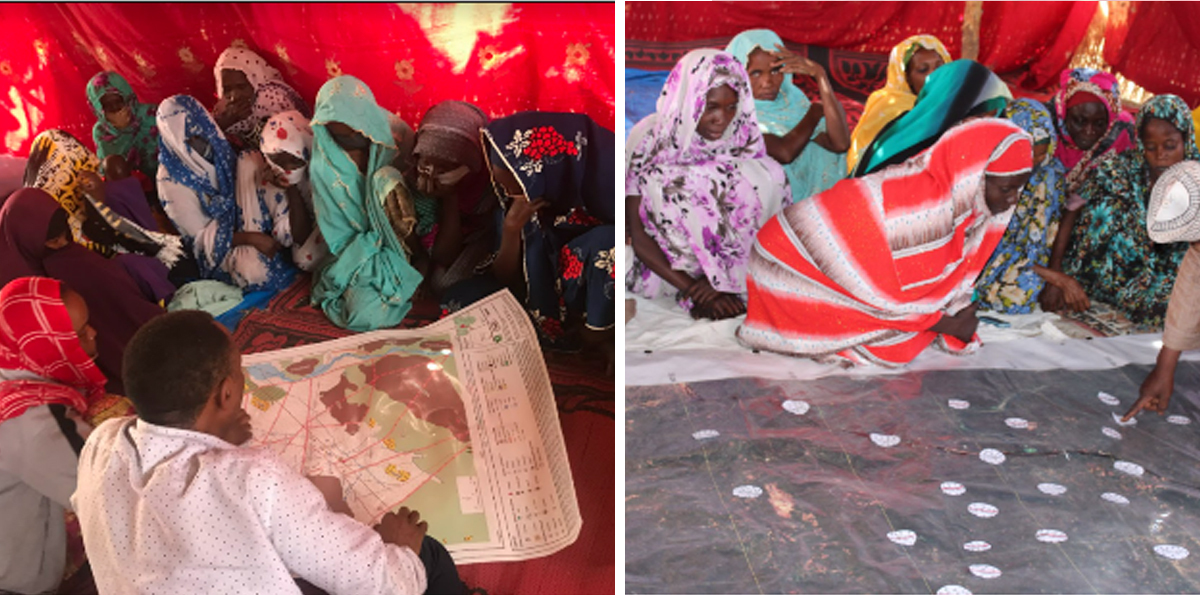
That’s the stage where the participatory mapping takes place. Members of indigenous and local communities have been gathering at Gournoida village to annotate the map using an agreed legend. The latter is a set of features (objects on the ground) represented by graphic symbols. These features include: Schools * Villages * Churches * Markets * Châteaus * Hospitals * Graveyards * Water pumps/towers * Swamps * Ponds (artificial, small, big) * cattle pens * cattle corridors * Plants, etc.
The participatory mapping exercise lasted two weeks and included two phases. Men took part in the first phase and documented objects such as water points, villages, or tree types.
Women then reviewed the annotations and added new objects to the map. Since Mbororo women are in charge of household chores (e.g., fetching water, milking and making milk products, cooking) and raising children, they updated the map to reflect their activities. Hindou also emphasises women’s seasonal knowledge about weather and flora and fauna linked with land use:
“Women know better than men what is going on in each place or territory during the rainy and dry seasons,” says Hindou Oumarou Ibrahim, adding, “So, local women mapped the areas where certain vegetables grow during the rainy season, as well as areas with edible, medicinal, and sacred plants, springs, food storages, schools, etc.”
By inviting women to contribute to the project, Hindou strives to gradually change the traditional perception of women who, traditionally, have had limited decision-making powers in family and community-wide matters.
“The project allowed women’s voices to be heard, turning them from observers into decision-makers. So for me, it’s the exercise that empowers women and helps men realise that their wives, mothers, or daughters have a voice and are very knowledgeable,” says Hindou Oumarou Ibrahim.
4. Map finalisation
The goal of this stage is to combine and verify mapping results and create a digital version of the map for further dissemination among communities.
But before the map is digitised, one must check whether mapping results are acceptable to the community. Three workgroups, each responsible for checking given map objects (e.g., cattle corridors, water sources, churches, mosques, markets), evaluated the annotations. Participants inspected territories with GPS apps to ensure coordinates of objects were correct and to specify additional object types (e.g., types of plants or crops) as necessary.
By the end of December 2021, the map was finalised and presented to the communities and local authorities.
After all these steps had been completed, a series of high-resolution photos of the annotated map was taken for processing with GIS software. This was completed by specialists by the end of February 2022.
Mitigating conflict through mutual agreement
The 2D map will supplement a written agreement between community representatives on the use of natural resources and on ways of resolving future conflicts. Later in 2022, Hindou plans to host a convention with community chiefs to discuss and ratify the agreement. Many are looking forward to this meeting and the chance to see the results of their joint work.
“They are calling me, even in Paris. One community chief recently called me asking when I am coming back,” says Hindou. It’s worth noting that communities have been supporting the project with great enthusiasm. Initially, only 24 communities participated in the mapping, but 116 were involved by its end. The map itself was originally intended to represent an area of 40-60 sq.km., but now extends across 1,728 sq km.
Hindou also notes a high level of self-organisation among those involved. Locals even decided to construct a building in Gournouda in which to store a physical map.
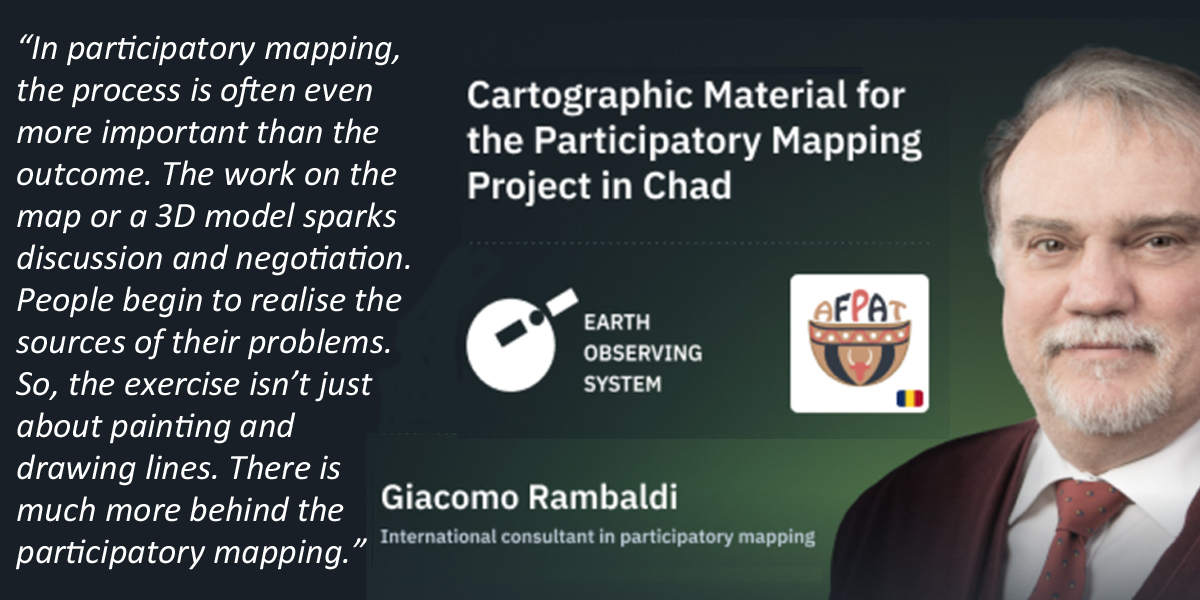
Giacomo Rambaldi emphasises the human impact of the initiative. “The mapping exercise gives those involved a bird’s-eye view of their surroundings and, in many cases, an understanding of the root causes behind the environmental or social problems they face.
“In participatory mapping, the process is often even more important than the outcome. The work on the map or a 3D model sparks discussion and negotiation. People begin to realise the sources of their problems. So, the exercise isn’t just about painting and drawing lines. There is much more behind the participatory mapping.”
Andriy Kuzmenko agrees that the human dimension of the project was important. “I realised that the project means a lot to many people who face struggle on a daily basis. That is what drove me when working on the assignment. Our company’s mission is to put satellite technologies, ML algorithms, and data to use so that customers worldwide can solve daily problems. I think we managed to deliver services in accord with this mission and was pleased to play my part
.Hindou Oumarou Ibrahim and colleagues don’t plan to stop there. The next project is a map for communities living north and south of the shrinking Lake Chad. The EOS Data Analytics team has already provided a satellite image-based map, which Hindou has printed for the participatory mapping exercise. So, stay tuned: We’ll tell you more about this initiative soon.
Subscribe to our newsletter
Stay updated on the latest technology, innovation product arrivals and exciting offers to your inbox.
Newsletter