Share
April 2014 saw the return of ‘smog’ to the skies over large swathes of south and south east England. Emissions from domestic vehicles, factories and homes coincided with gentle easterly winds that brought in additional pollution from Europe and combined with Saharan dust, whipped up by a storm thatproduced gale force winds in north Africa, to create the ‘perfect storm’.
This combination of pollution and weather events presented as milky white air that obliterated the sun and shrouded much of England for several days. Residents in affected areas were advised to stay indoors and avoid strenuous exercise while sufferers of respiratory and heart problems were warned of potential flare ups of existing conditions.
Nothing New
Air quality concerns are not new. The infamous ‘pea soupers’ in London are even mentioned by Dickens and many people in the UK are aware of the tragic consequences of the 1952 London fog which led to thousands of deaths and the eventual implementation of the Clean Air Acts of 1956 and 1968. In 1999 air pollution resulted in hospital visits for more than one million people in Mexico City and, despite planting tens of thousands of trees and introducing alternative fuels for government vehicles, remains one of the most daunting environmental issues for the city.
Around the world China continues to make headlines amid international concerns that economic growth is being prioritised over health. Recent reports have suggested that Beijing will introduce emergency measure similar to those implemented for the 2008 Summer Olympics ahead of the Asia-Pacific Economic Cooperation (APEC) Economic Leaders' Meeting later this year.
Threat to health
Nitrogen dioxide (NO2) is part of a group of highly reactive gasses known as nitrogen oxides. NO2 forms quickly when fossil fuels are burned for example petrol or diesel in a car or natural gas in a domestic boiler or power station and there is clear evidence that high levels of NO2 are linked to adverse effects on health. These include increased risk of respiratory illnesses, such as bronchitis, and even heart attacks, with World Health Organisation statistics show 1.3 million deaths worldwide resulting from outdoor air pollution.
Threat to wildlife
The nitrogen within the recent smog outbreaks does not just impact on human health. It has been reported that nitrogen deposited from the air to the ground and stored within the soil has reached critical levels.
This ‘hidden killer’ has the potential to wipe out entire species and destroy ecosystems. Nitrogen rich soil reduces biodiversity by supporting species which thrive on nitrates at the expense of those that don’t. High levels of nitrogen can also cause problems by leaching into groundwater. This can prove toxic to cattle and sheep and cause problems for small infants by impairing the blood’s oxygen carrying capacity. Once in the ground, nitrogen can remain for hundreds if not thousands of years.
Keeping tracks
Currently in the UK air quality is monitored via a national network of over 130 urban, suburban, roadside, industrial and rural monitoring sites, known as the Automatic Urban and Rural Network (AURN). AURN continuously captures ambient concentrations of selected pollutants throughout the UK although some data is also collected manually.
DEFRA has a duty to report to the EU on air quality every 5 years and local authorities currently review and assess current and future air quality in their localities against health-based objectives. Where it is predicted that these objectives will not be met, and public exposure exists, the local authority must declare an Air Quality Management Area (AQMA). Nationally, we are not achieving all of our legally binding targets for nitrogen dioxide and now we face legal action by the European Commission for failing to reduce excessive levels with fines of up to £300m a year. The main challenge for the UK is in meeting nitrogen dioxide limits alongside roads in cities and towns.
Pollutants move with the air and as such areas that generate air pollution, such as roads, may create impacts elsewhere. As a static network the AURN may not provide the full picture as to where the pollutants actually affect; making it hard for Local Authorities and government to fully understand how to address it.
Taking to the skies
Scientists at the University of Leicester are at the forefront of research into monitoring of air quality. Using ground breaking technology a partnership between the University and aerial mapping company Bluesky has already mapped levels of nitrogen dioxide across the East Midlands city of Leicester.
The Airborne Air Quality Mapper (AQM) utilises the University of Leicester’s world leading Compact Air Quality Spectrometer, mounted on a dedicated aerial survey aircraft. The device monitors visible light and measures how much light is lost at specific wavelengths absorbed by NO2. The technology has previously been used as part the CityScan project with devices mounted on tall buildings in Leicester, Bologna and London during the Olympics to build 3D maps of pollution across the cities.
The air quality mapper (AQM) can be used to measure nitrogen dioxide (NO2) levels through application of differential optical absorption spectroscopy (DOAS), a passive remote sensing technique that uses the spectral signature of sunlight reflected off of the Earth’s surface to determine how much NO2 is in the sunlight’s path through the atmosphere. From these measurements vertical column densities of NO2 can be determined, and surface levels of the pollutant can be estimated at resolutions of approximately 20m by 20m. This means that air pollution across an entire city can be mapped during a single flight.
Proven technology
While the data sensor may be new the thinking behind aerial collection is anything but. By working with an industrial partner the University of Leicester can benefit from the experience and expertise of one of the UK’s leading aerial survey companies. This eases potential problems obtaining flying permission over populated cities and ensures all data is collected to the highest possible standards.
Once processed, the colour coded air pollution maps created from the AQM data can be overlaid on digital maps or online mapping systems such as Google Earth. By combining with other data potential sources of pollution can be identified as can patterns of distribution. This intelligence can then be used to inform policy, planning and pollution control measures, for example.
Early trials of the AQM have already revealed some interesting phenomena and the University of Leicester is expected to publish full results in an academic paper due out soon. However, this is not the end of research into monitoring of potential pollutants in cities and towns. The University of Leicester is also partnering Bluesky with trials of the world’s first integrated night mapping system. Combining a specially adapted camera with Bluesky’s state of the art LiDAR and thermal imaging sensors it is hoped the trials will produce essential data to help combat light pollution, energy wastage and help manage urban habitats. The resulting map accurate images will be a useful tool for managing street lighting operations and maintenance and as a resource to tackle energy inefficiency.
James Eddy is Technical Director and co-founder of aerial mapping company Bluesky (www.bluesky-world.com) and holds the honorary title and status of Industrial Associate at the University of Leicester.
Pictured above:
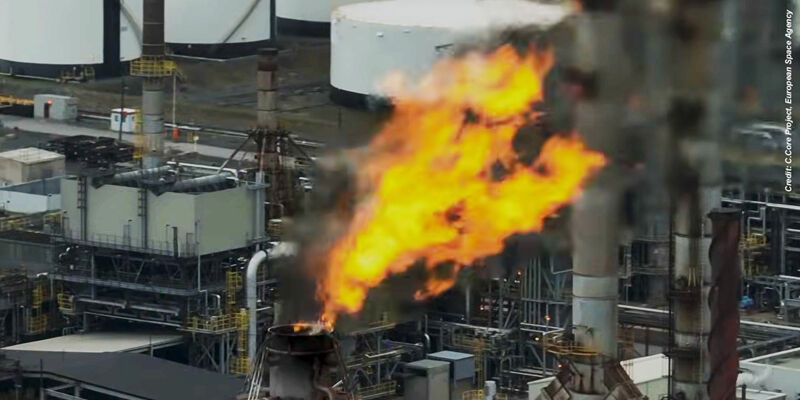
1. Examples of possible air pollutant producers
2. Relative NO2 levels around Abbey Park in Leicester. Here, the park is shown to have lower amount of N02 than its more polluted surroundings. Note how quickly the levels drop off as you enter the park
3. Relative N02 vertical column densities across South Leicester. Brown/red indicates higher concentrations. Progressing from the city centre (top) towards the southeast part of the city, a clearly decreasing spatial gradient is shown
4. Spatial coverage of the AQM N02 vertical column density measurements compared with the spatial coverage of ground-based in situ air quality stations. Here, 20m x 80m AQM sampling regions are used to produce a highly resolved and extensive picture of spatial distributions of pollution across the city which could not be generated from the ground-based data alone
Subscribe to our newsletter
Stay updated on the latest technology, innovation product arrivals and exciting offers to your inbox.
Newsletter