Share
Data Analytics are crucial to helping organisations respond to change, navigate uncertainty, and identify opportunities.
As recognized by Gartner in technology trends for 2021, Data and Analytics are increasingly being seen as a core business function and implementing a dashboarding tool is often seen as a “quick win” for improving analytics.
Dashboarding is a key method of efficiently analysing your data, displaying metrics and trends at a glance. They enable you to improve your decision making, revealing insight into Key Performance Indicators (KPIs) and other metrics via intuitive visualisations.
In fact, dashboarding and infographics have become so commonplace, we see them in all areas of daily life – from productivity tooling in the workplace such as JIRA, to collating personal data from fitness and wearables technology like Fitbit and Strava. In a data driven world, we have grown to expect simple and effective data visualisation in all areas of our lives.
1Data Gateway includes its own intuitive Dashboard out-of-the-box, and the latest release adds API functionality so it can easily be connected to an external dashboard.
There are a variety of tools on the market to meet this growing need for customisable data dashboarding, but here we’ll walk you through how we can quickly and easily connect 1Data Gateway to Microsoft’s Power BI.
Using the REST API
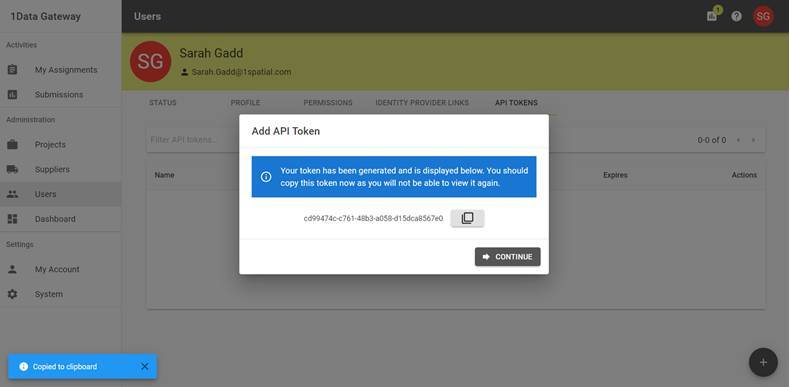
In order to access the API, we first need to obtain an API Token from 1Data Gateway. This can be obtained by a System Administrator via the Administration > Users page, within the API Tokens tab of a user profile. You should copy this token now as you will not be able to view it again, and will need it in later steps.
The Swagger API documentation can then be accessed from Settings > System > Help and Support. A link to the API Reference is found under Data Gateway Documentation.
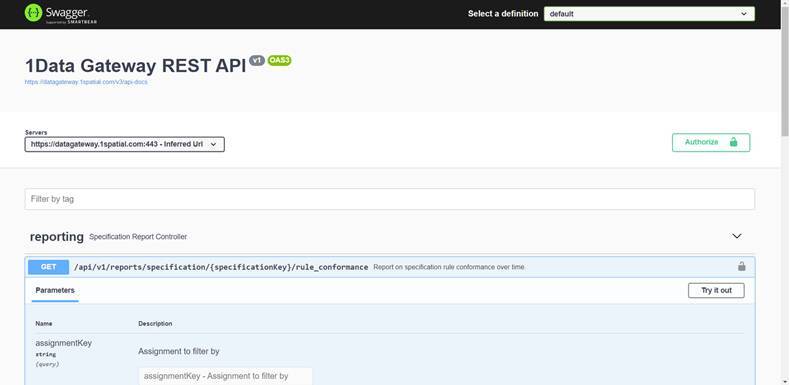
Click Authorise and enter your API Token. Now you can test queries to gather reporting information on submissions, rule conformance and task conformance from 1Data Gateway.
Now that we know the connection strings, we can go to our chosen dashboarding tool and configure the connections.
Connecting to Microsoft Power BI
Create a new project in Power BI and then select Get Data.
Select Other > Web and then click Connect.
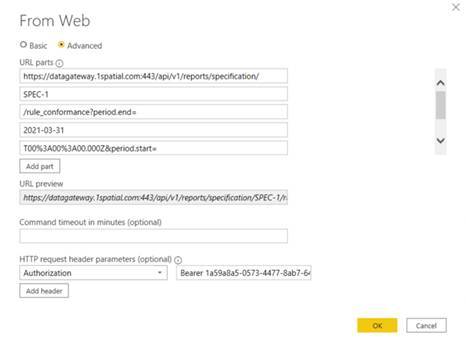
Select Advanced and then enter details to connect to your 1Data Gateway installation.
For the HTTP request header parameters, add an Authorization header with a value of “Bearer [API Key]” where [API Key] is the unique key we obtained earlier and tested using Swagger.
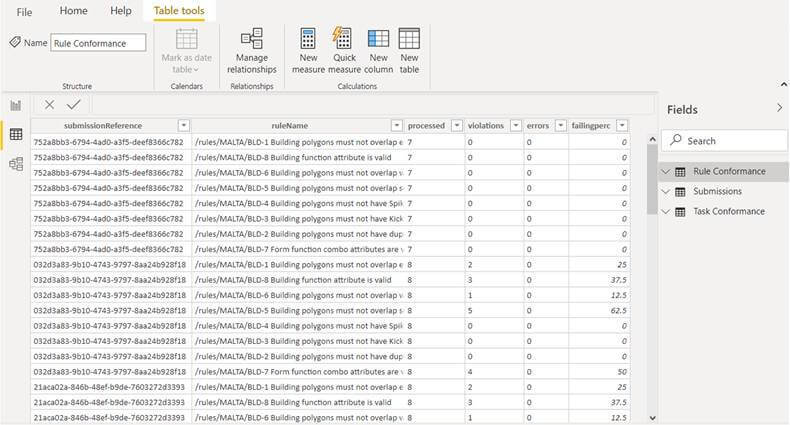
Now we can get our data into PowerBI so we can transform and format it according to our needs.
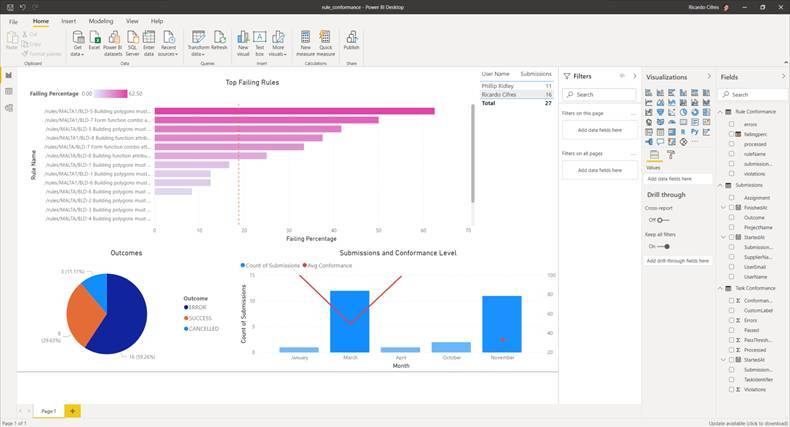
Now that we have our data tables ready, we can create our custom dashboards with up-to-date data.
In our example we’ve set up a dashboard to quickly examine which rules are finding the most non-conformance percentages, how conformance varies over time and a timeline of submissions per month.
Being able to quickly see how your data is most commonly failing your business rules can be essential for prioritising efforts to fix it.
If you would like to find out more about 1Data Gateway or any of the other 1Spatial products and solutions, please get in touch.
Subscribe to our newsletter
Stay updated on the latest technology, innovation product arrivals and exciting offers to your inbox.
Newsletter